
I mean, 2020 to 2024 were the Biden years so that is not completely surprising to me as their administration tried to strengthen pan-atlantic ties.
Bingo… Biden was a huge support to Europe.
It is quite saddening that we have to flip the table so drastically because of the new administration.
We do what we must
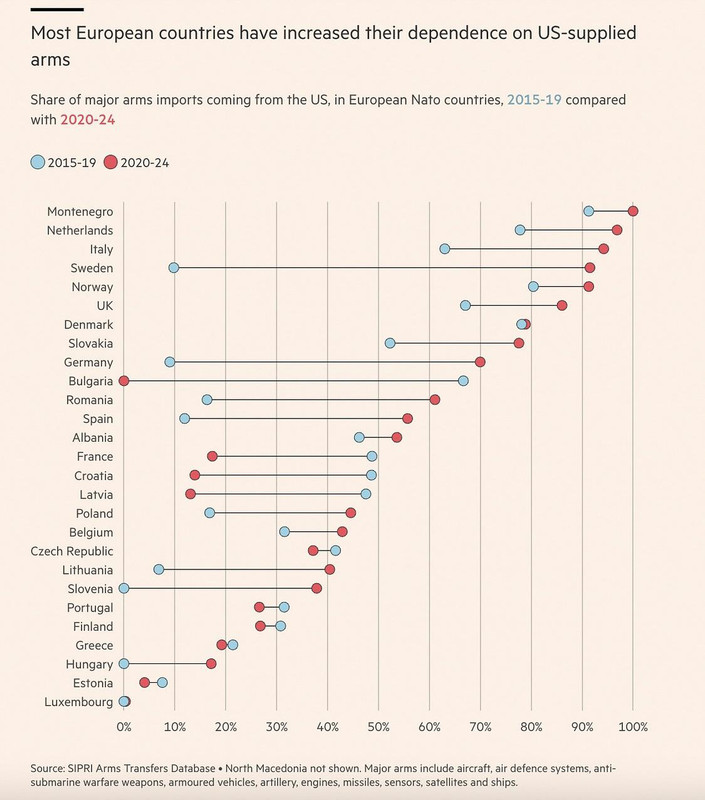
I’d like to know a bit more about this graph.
Things are always more complex than they seem and I’d hate for relevant news to contribute to someone’s doomscrolling habits. We have too much fear already.
So a couple of comments from the top of my head:
You don’t buy stuff like fighters everyday so the data points are quite scattered over time and have huge weights.
Does this graph represent money spent or commitments?
The first date is in 2015, after the Crimea annexation which probably spurred arms deals and at that time most likely from the US since there was a strong NATO positive momentum at the time.
The second date is in 2020 so five years later. If the graph displays money spent then the deals made after the annexation of Crimea would only start to show up a few years later. This would also explain the overal shift towards US buys.
Another thing to note is that the shift displayed here happened in a five year time period. It’s also been five years since the last data point on the graph.
The shift towards EU manufactured military equipment is still expected to be somewhere in the future so there’s little doubt that the issue is wrongly depicted. However it is a bit two dimensional when you conider the fact that the journalist made the choice of what to include and what not to include. They could’ve chosen to include a projection of future spending or perhaps more historical data. They could also have added a breakdown of purchaed equipment.
Lastly, the title is “Most European countries have increased their dependence on US-supplied arms”. Again, I don’t doubt this is true but I would also like to see these numbers compared to the entire defense budgets, their growth and if possible a comparison between how much has been bought and the value of existing equipment. Any of these metrics could put this graph in a very different light.
this truly sucks, when we have european arms manufacturing as well.
Am I reading that wrong, most seem to have decreased since 2020
Yes, you have it reversed. The red (2020-24) is more recent than the blue (2015-19).
Wow crazy moment. I was blind to thinking it said 2020-2025. That’s what I get for only a few hours of sleep and doing way too much today. Thanks


